Every meter checkedautomatically, each time a line is re-energized
The problem
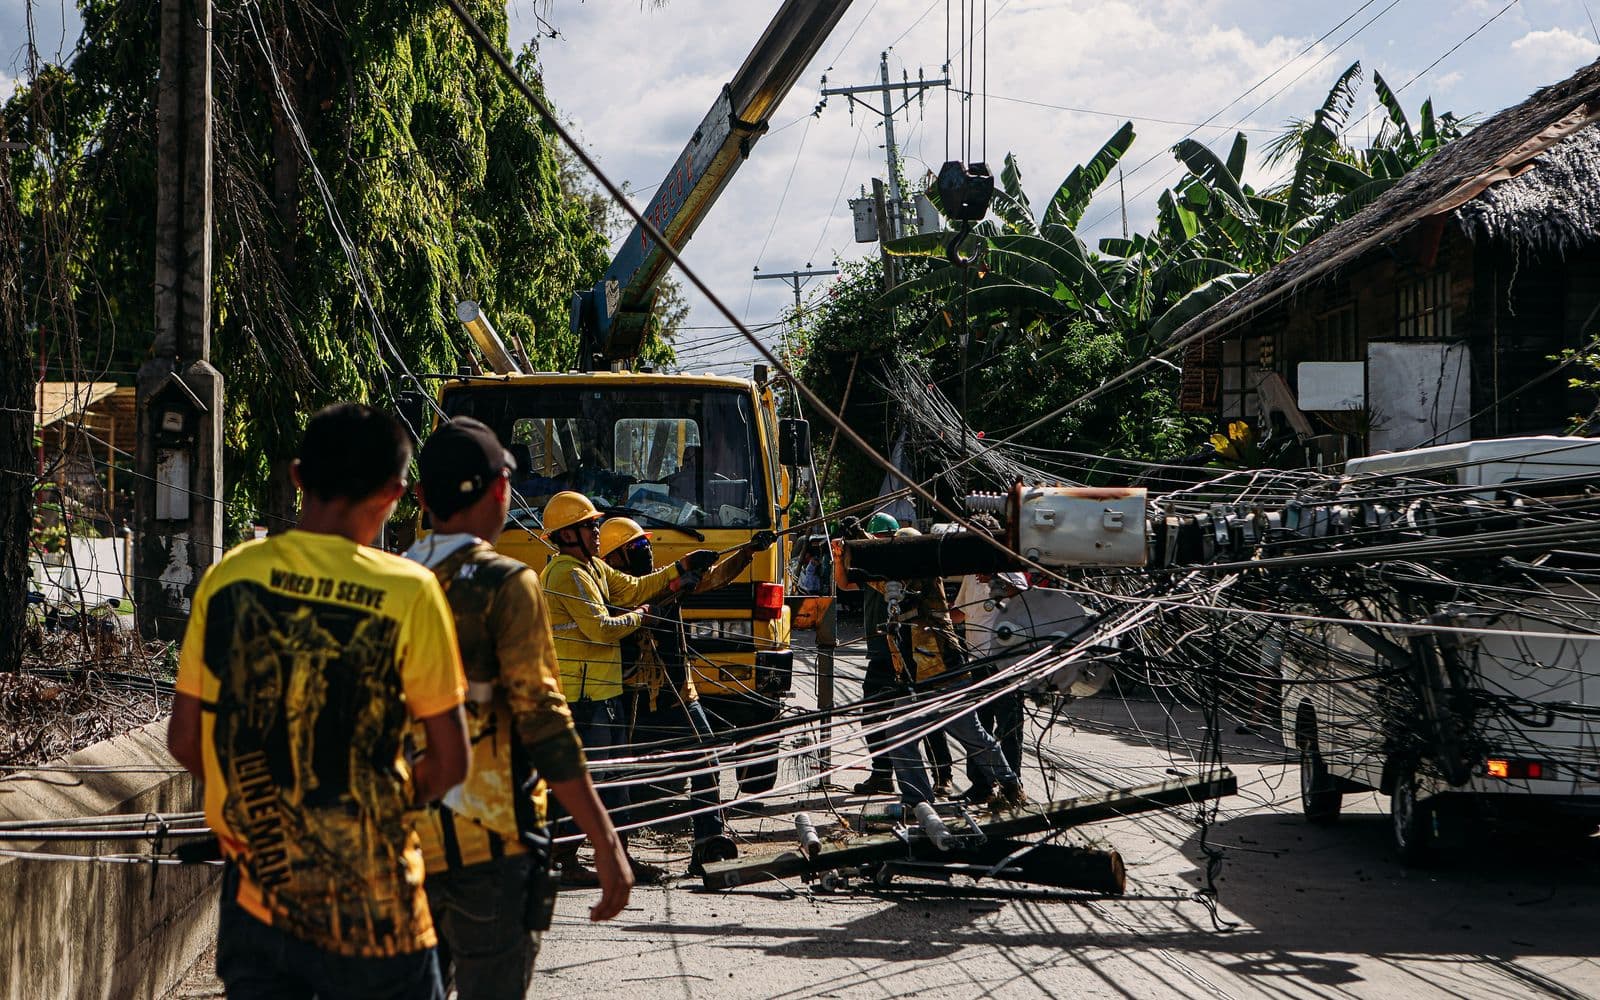
After a major hurricane, the slow part of restoration is the tail: customers dark behind a blown fuse or a downed service drop on a line that shows as restored. They are found only when they call or a crew drives past, while a workforce of thousands stays deployed.
What we ran
A storm replay on a public synthetic distribution network: hurricane damage, crews, customer calls, and smart meters whose communications can fail. Three approaches run on the same 200+ storms: no meter data, manual meter use as large utilities do it today, and the agents. The replay is specified and has not run yet, so this page carries no Evardi number.
What the agent did
The agents check every meter automatically each time a line is re-energized, group dark meters by the likely failed device, and sequence restoration switching with every step checked by power flow. The claim is only the gap between manual meter use and the agents.
Published results at other utilities
These are other utilities' results, driven mostly by automated switches. They show the size of the prize, not Evardi's share.
| Utility and storm | Measured result |
|---|---|
| A city utility, 2012 derecho (about 174,000 customers) | Restoration up to 17 hours faster. Lawrence Berkeley National Laboratory valued the avoided customer cost at about $23 million for that one storm. |
| The same utility, 2014 snowstorm | About 36 hours sooner, about 20 of them from smart meter pinging and crew redirection. |
| A Northeastern utility, Superstorm Sandy | Restoration 2 to 3 days sooner, with about 6,100 truck rolls avoided or made more useful. |
Sources: U.S. Department of Energy smart grid storm results; Lawrence Berkeley National Laboratory, Interruption Cost Estimate case study.
Results
| Measure | Today | With Evardi |
|---|---|---|
| Meters checked after each re-energization | Pinged by hand | Every meter, automatically |
| Dark meters grouped by likely failed device | By hand, from calls | Automatically |
| Restoration steps power-flow checked | Spot checks | Every step |
What it is worth
- Customer value: customer-hours restored sooner, priced with LBNL's Interruption Cost Estimate calculator
- Restoration cost: crew-hours avoided × all-in cost per worker-hour from a public storm-cost filing
* Study simulated with partners on public data.
Run it on your network
Your outage and meter logs from one past storm. We replay it and show how many customers the agents would have found sooner.
Book a demoSee Storm restoration on the platform
Full study
Request the full study.
The complete write-up of “Hurricane restoration: the meter-data side, automated”: method, data, results and assumptions, as a PDF. Leave your work email and we'll send it.