61%of inspections find a real problem, vs 6% from billing flags
The problem
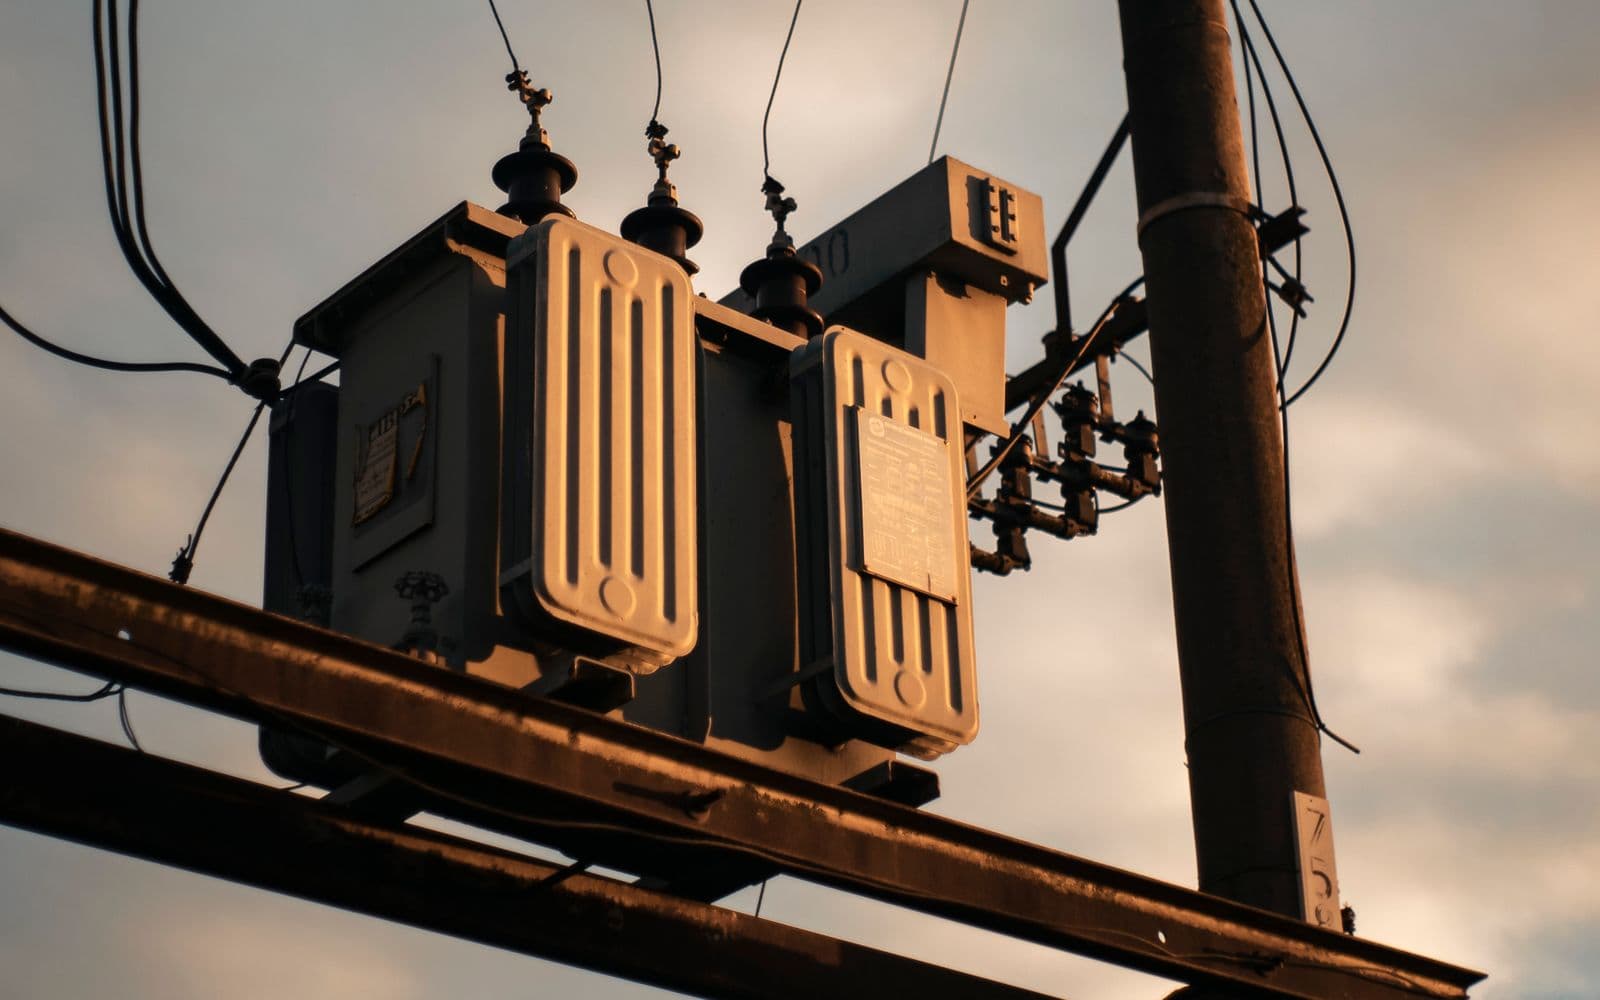
On most distribution networks the last metered point is the substation feeder. Below it, hundreds of transformers serve thousands of customers with no measurement at all. Operators can't see which transformers are stressed, and loss-reduction crews pick inspections from billing flags that are usually wrong.
What we ran
We rebuilt an 11 kV feeder with 109 transformers from the utility's published network data. The methods were frozen before testing, then scored blind against nine new versions of the feeder with planted metering faults, theft and customer-to-transformer map errors.
What the agent did
Virtual meters learned from feeder-head SCADA and customer billing, applied power flow between them, and estimated energy and peak at every transformer. The agent then ranked customers for inspection and proposed corrections to the connectivity map. Crews and engineers decide what to act on.
Results
| Measure | Today | With Evardi |
|---|---|---|
| Transformer energy estimate, with no transformer meters | Not visible | 5.5% median error (2.7% to 8.5%) |
| Transformer peak estimate | Not visible | 6.2% median error |
| Inspections that find a real problem | 6% (billing flags) | 61% |
| Planted map errors corrected | Found by field audit | 57% |
What it is worth
- Inspection visits avoided × cost per visit
- Plus losses recovered sooner × tariff, valued at the utility's loss rate
* Study simulated with partners on public data.
Run it on your network
A feeder map, and a year of feeder-head SCADA and billing data. We return a virtual-meter view of that feeder and a ranked inspection list.
Book a demoSee Virtual meters on the platform
Full study
Request the full study.
The complete write-up of “A meter's view of 109 transformers, with no transformer meters”: method, data, results and assumptions, as a PDF. Leave your work email and we'll send it.