60%of overload failures flagged a year or more ahead
The problem
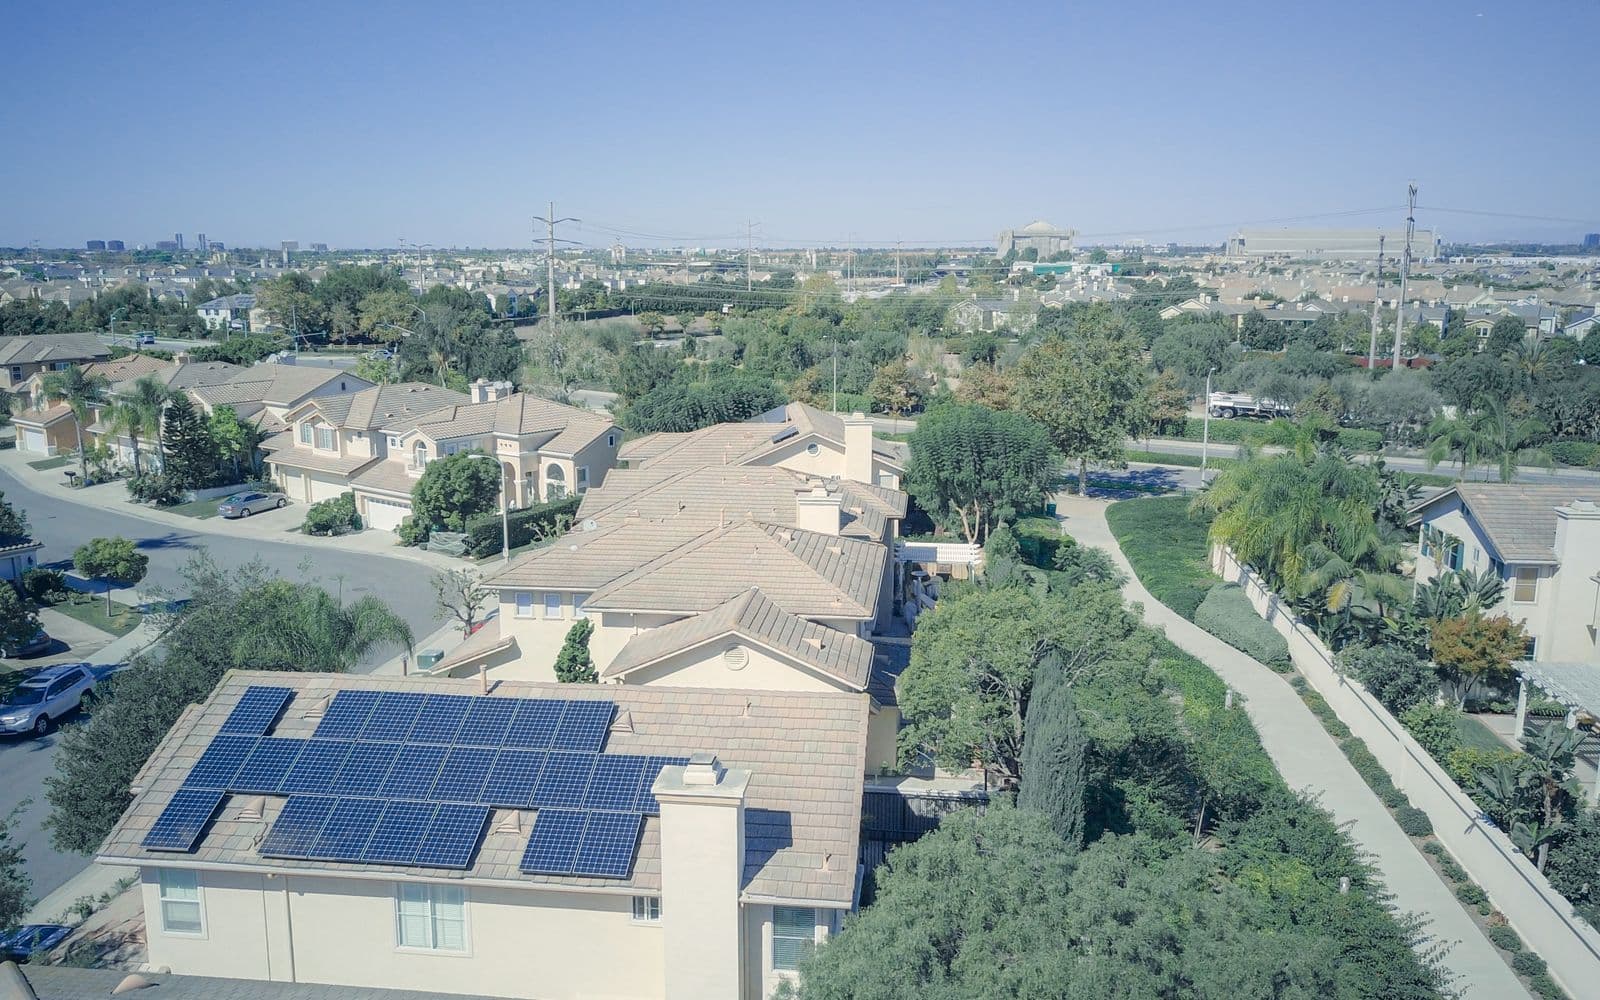
A fast-growing city utility plans upgrades from feeder-level forecasts and rules of thumb. Transformers on streets where EVs and heat pumps cluster fail from overload before any plan flags them, while some capacity projects get built years before the load shows up. Each rooftop solar or battery application takes an engineer hours to review.
What we ran
A municipal network of 60,000 customers and about 8,000 service transformers. Ten years of growth ran under low, expected and high scenarios for EVs, rooftop solar, heat pumps, batteries and new large loads, then compared against a rule-of-thumb plan.
What the agent did
It projects loading on every transformer and feeder at 2, 5 and 10 years using virtual-meter load shapes, flags each asset that crosses its limit and the year it does, ranks upgrades by year and risk, and pre-screens each solar or battery application against the projected loading. Planners approve the plan.
Results
| Measure | Today | With Evardi |
|---|---|---|
| Transformer overload failures seen coming | Few, from field reports | 60% flagged a year or more ahead |
| Engineer time per solar or battery application | 3 hours | 30 minutes |
| Planning view | Feeder-level, annual | Every transformer, 2, 5 and 10 years |
What it is worth
- Utility cash: emergency replacements avoided × premium over a planned replacement, plus capital timed to need × bond rate
- Staff capacity: applications a year × hours saved × loaded engineer hour
* Study simulated with partners on public data.
Run it on your network
The feeder model, a year of smart meter load and the interconnection queue. We return a 10-year loading map for one substation area.
Book a demoSee Virtual meters on the platform
Full study
Request the full study.
The complete write-up of “Every transformer's load at 2, 5 and 10 years, before EVs and solar arrive”: method, data, results and assumptions, as a PDF. Leave your work email and we'll send it.